

")
Hard-to-Heat Homes in Britain with rising living costs, heating homes is not always easy for every household and fuel poverty is now sadly heard on a regular basis.
Ordnance Survey (OS) has analysed 23.6 million homes across Great Britain. With over 600 million data features, the OS NGD provides trusted, authoritative insight into Britain’s buildings, including age, construction material, roof structure and solar panel presence. The data was used to identify trends and compare the physical characteristics of homes using a heat index to assess how easy they are to heat, and which households might be more vulnerable when temperatures drop.
This analysis aligns with the government’s recently announced £15 billion Warm Homes Plan, which aims to help millions of families benefit from energy-efficiency improvements, save households hundreds of pounds on their energy bills, and reduce fuel poverty by 2030. This insight provides useful evidence for targeting retrofit investment, particularly insulation and solar installations, and could help local authorities and homeowners identify where energy efficiency improvements would have the greatest impact.
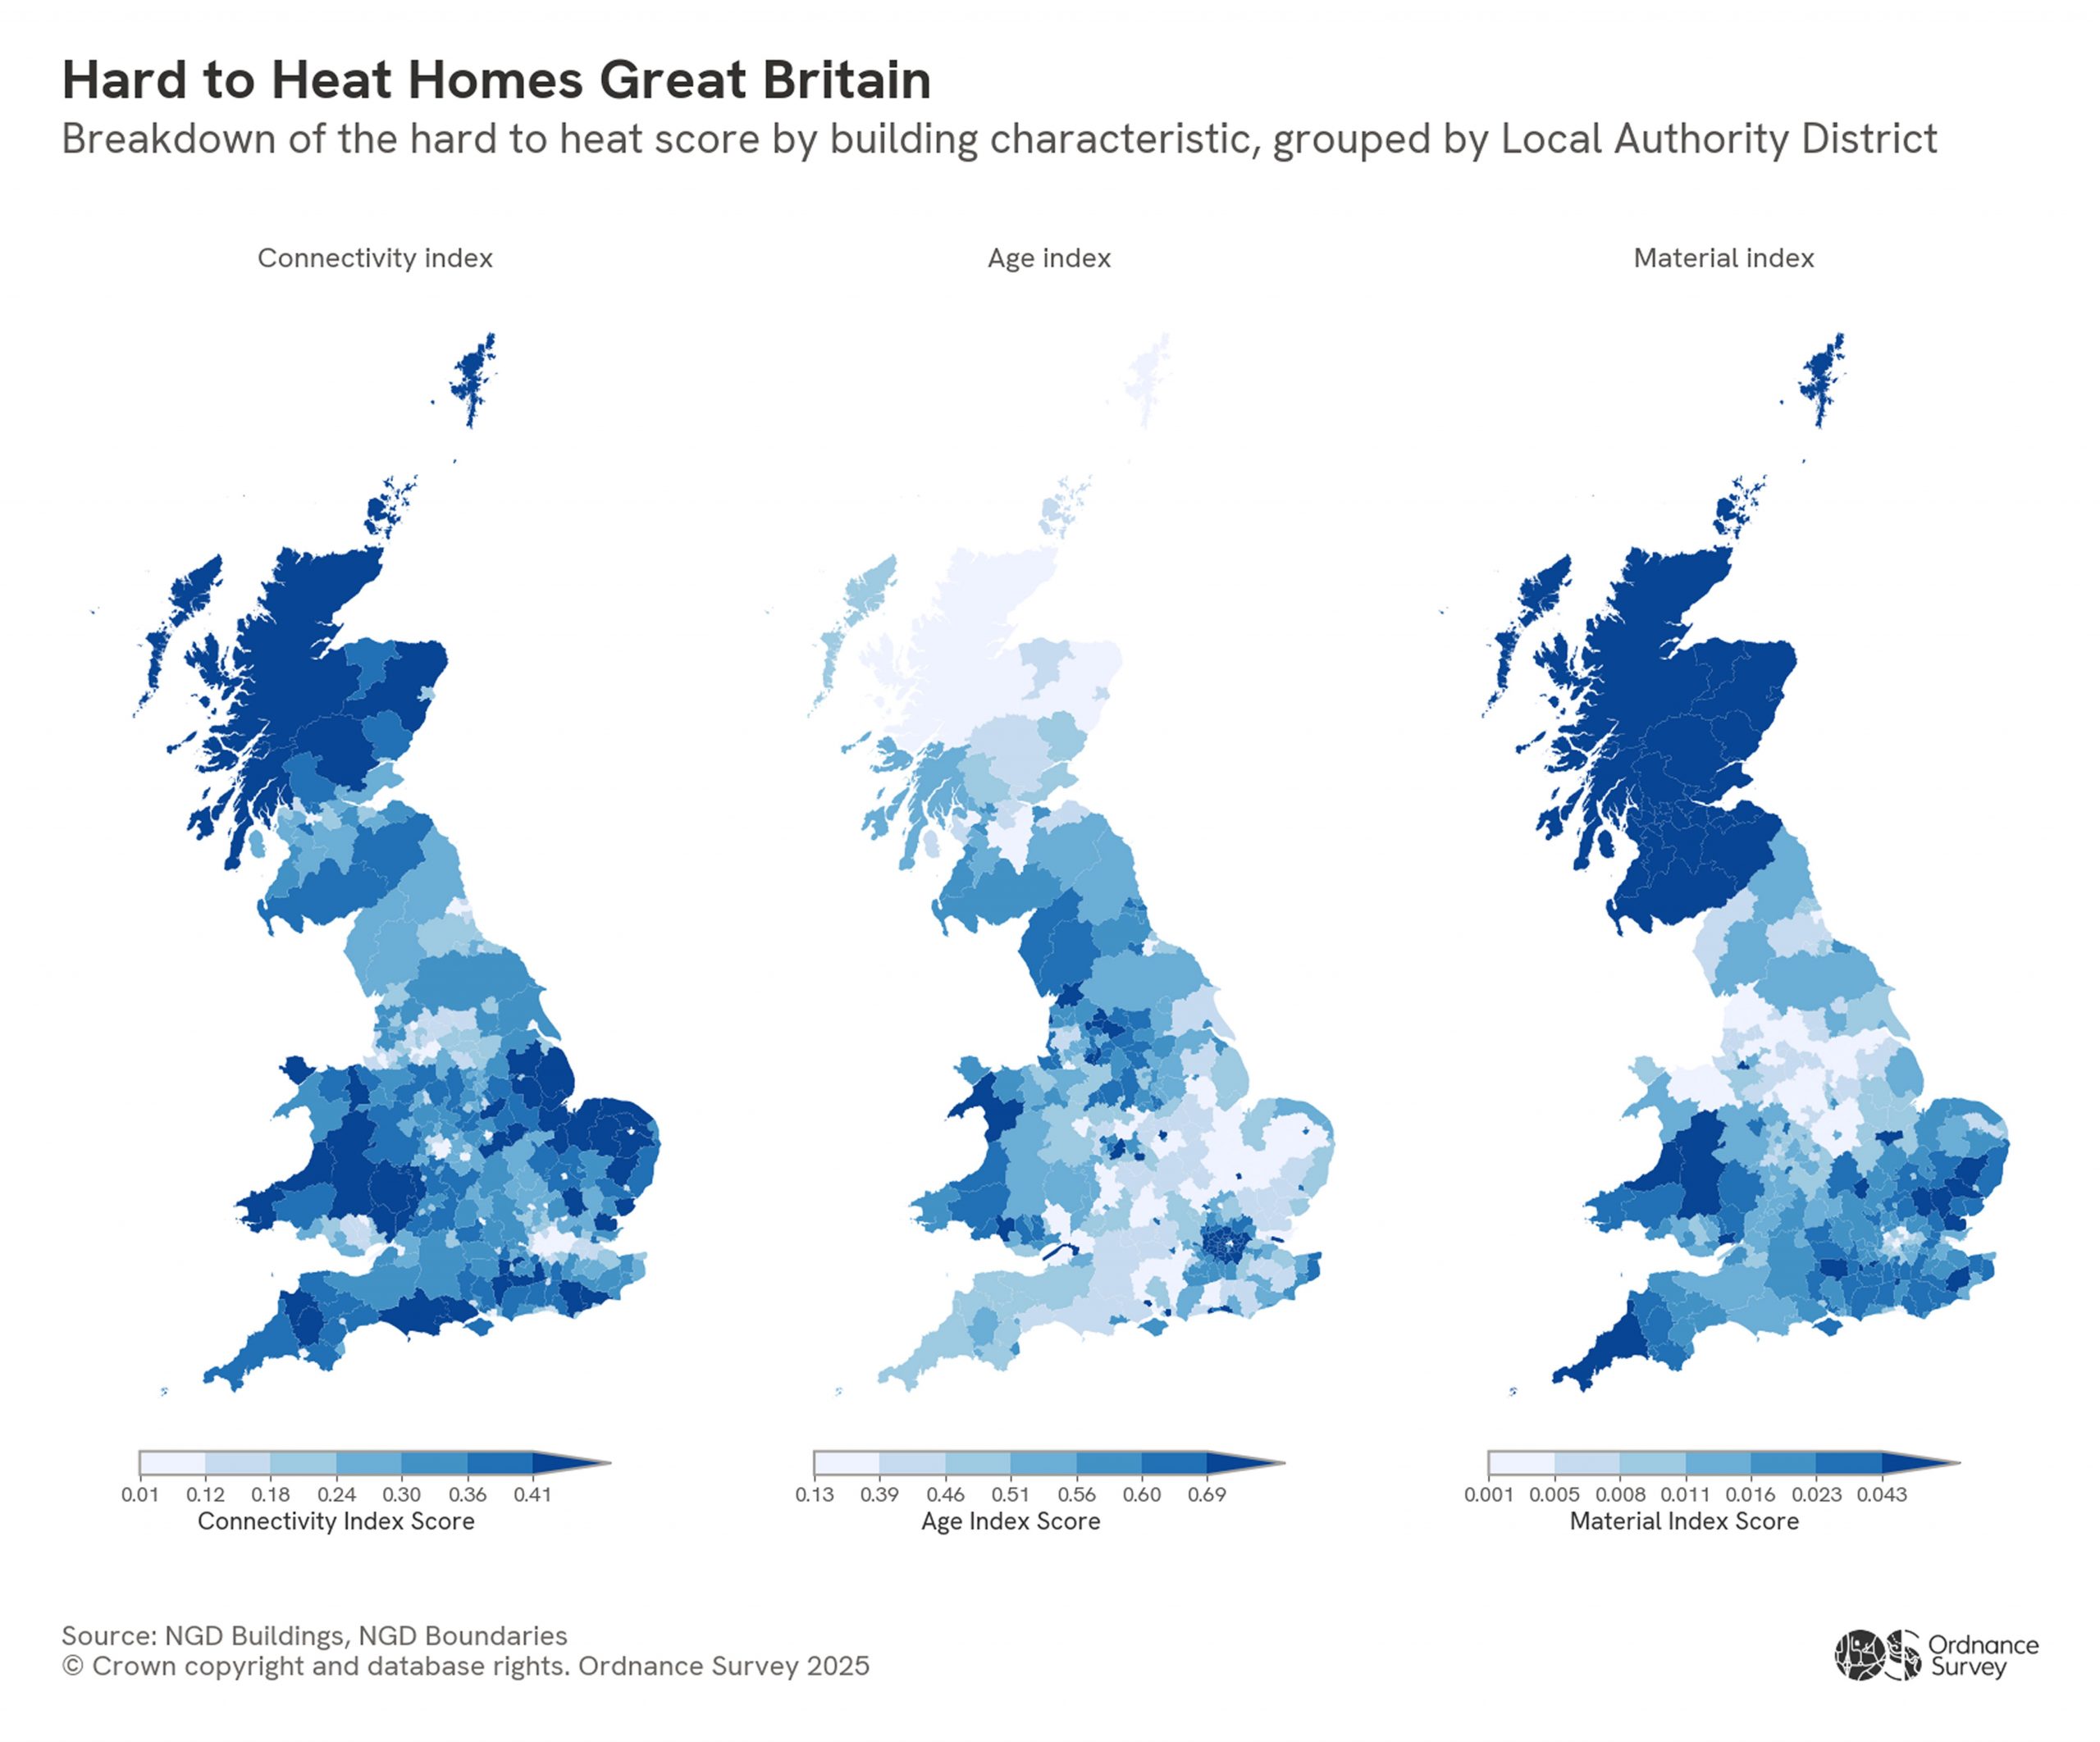
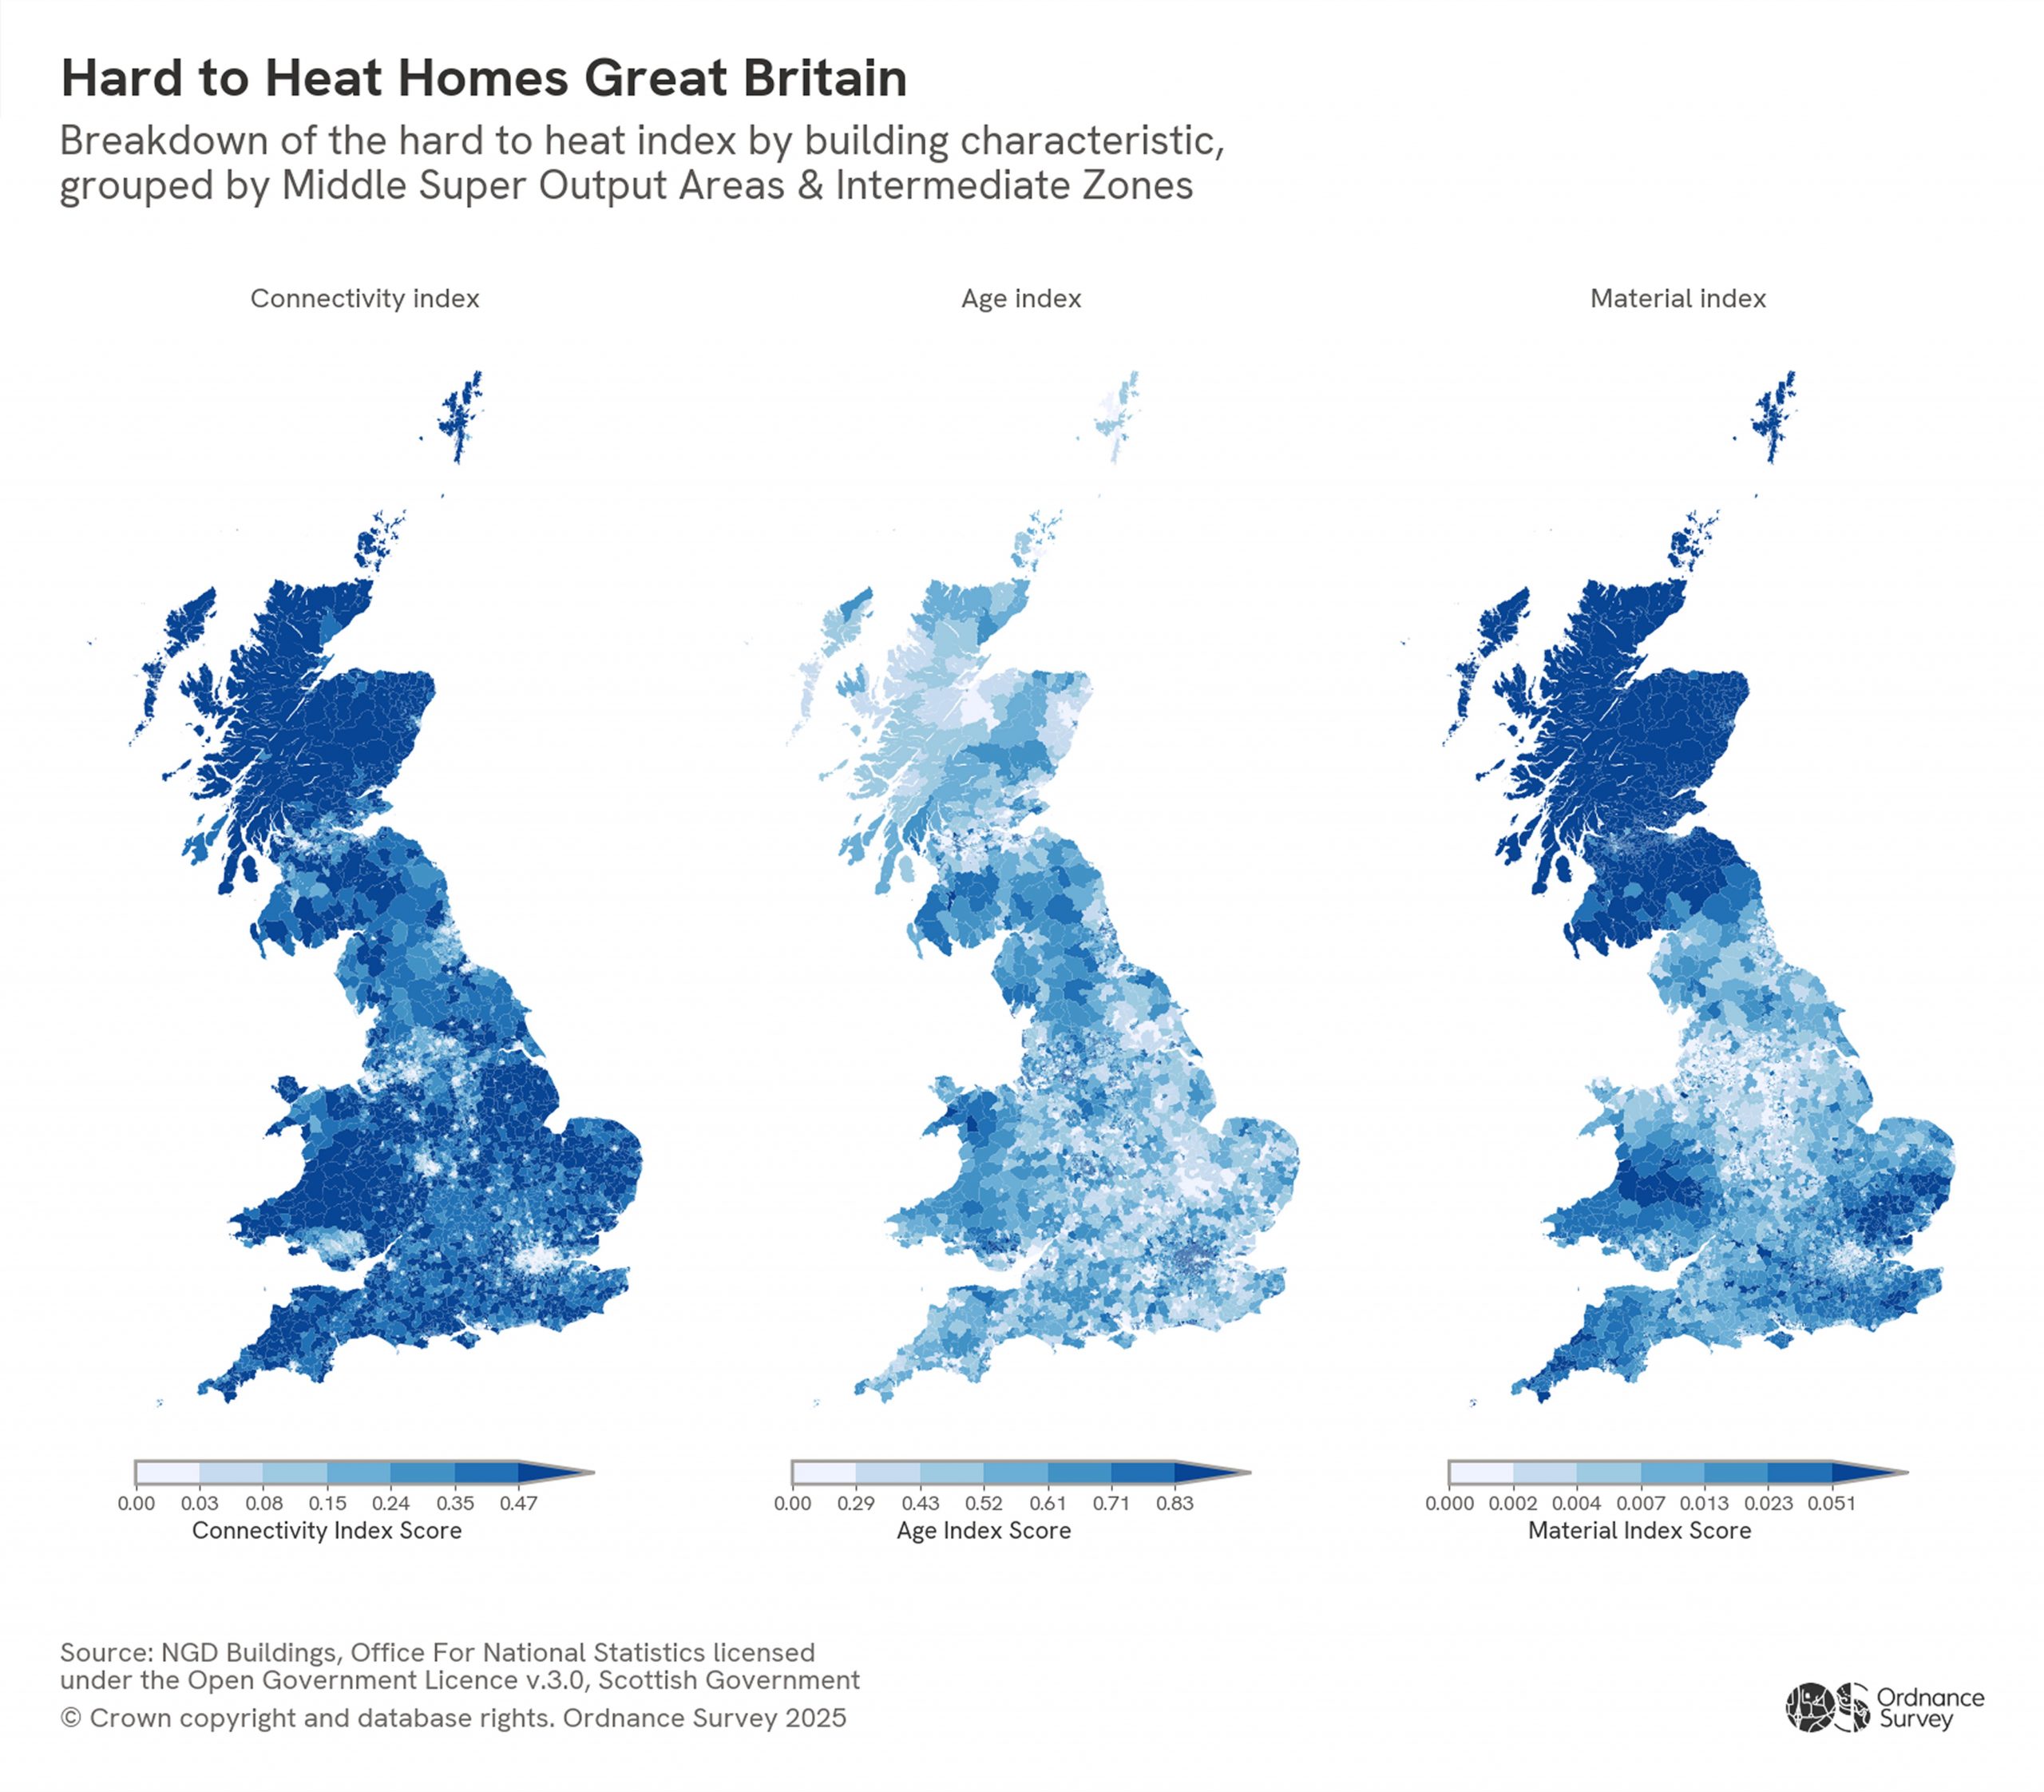
The analysis considered three key building characteristics:
- Connected homes – Properties with shared walls, such as terraced or semi‑detached homes, retain heat better than detached houses.
- Period of construction – Older properties built before 1960 are less likely to have cavity walls, insulation or double glazing.
- Construction material – Homes built with more insulating materials lose heat more slowly.
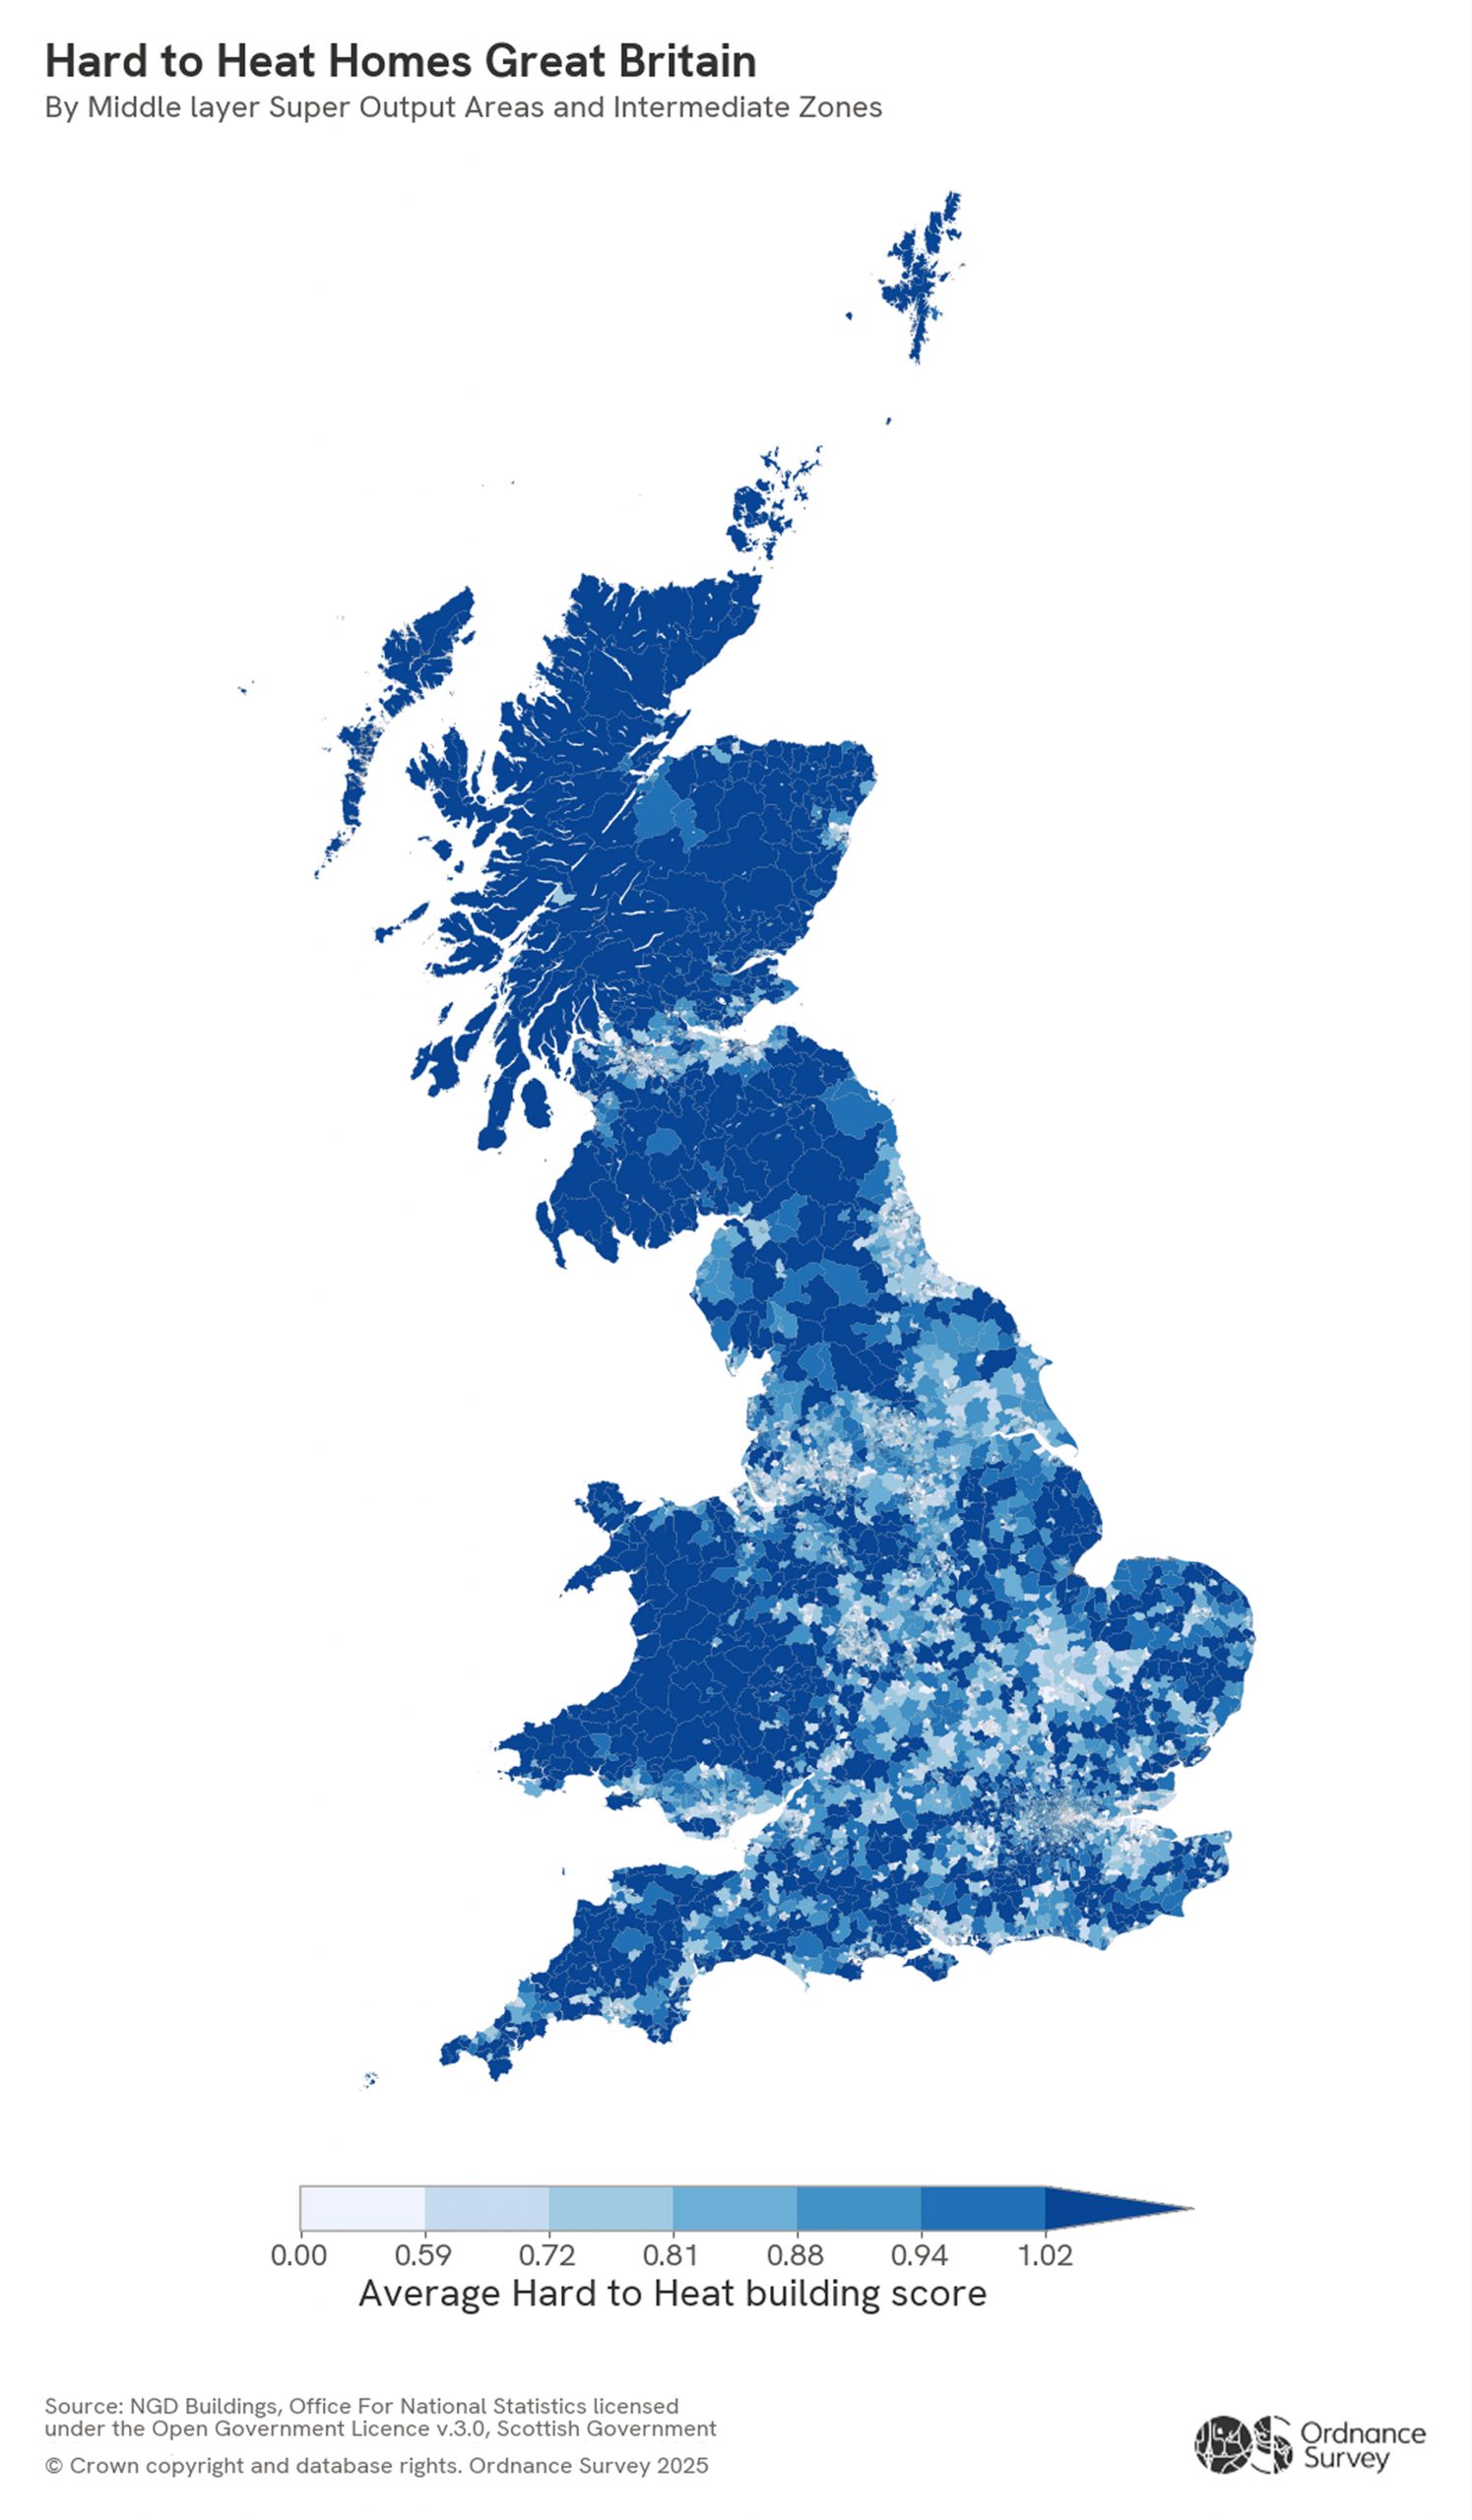
Initial analysis suggests that urban areas generally have a lower heat loss risk. This could be influenced by factors such as the urban heat island effect, higher ambient temperatures, and denser, often newer housing stock. In contrast, OS data indicates that coastal and remote areas tend to be harder to heat.
Local Authority Districts in northern Scotland and Wales have the highest average heat loss scores. Na ‑h‑Eileanan an Iar (Western Isles) has the highest average score of 1.30, while Stevenage in Hertfordshire has the lowest at 0.26. Across Britain, most Local Authority Districts fall between 0.8 and 0.95, with around 6% scoring 1 or higher.
Additional factors also play a role. In Cornwall, the predominance of traditional granite built homes can make insulation more challenging. Coastal areas in Wales and Scotland also have a higher proportion of detached properties – 29% in Wales and 32% in Scotland – meaning every wall is exposed to the elements. In the Scottish Highlands, older stone houses often lose heat through poor insulation, ageing windows and doors. While these details are based on general characteristics rather than OS data, they help illustrate why some areas face greater heat retention challenges.
In London, boroughs such as Tower Hamlets rank among the easiest to heat, likely due to a high proportion of flats with shared walls, modern construction standards, and fewer pre‑1960 buildings. In contrast, Harrow is among the hardest to heat, largely because of its high number of standalone properties and older housing stock.
Homes built post 1960 generally benefit from cavity walls, better insulation and double glazing. Building regulations introduced in the mid 1960s required insulation, with standards tightening significantly since then. As a result, newer homes typically require less energy to heat and are less prone to damp and condensation.
New towns such as Milton Keynes and Stevenage are among the easiest to heat, reflecting their largely post‑1960 housing stock. Stevenage has the lowest heat index overall and the highest proportion of post‑1960 homes, while Basingstoke and Deane also has a relatively low heat index due to more recent development.
Using OS data, it is possible to identify south facing rooftops suitable for solar panels, as well as areas with high or low existing solar uptake. In South Cambridgeshire, 14% of residential properties already have solar panels installed. Solar panels work throughout winter because they rely on daylight rather than temperature, although shorter daylight hours do reduce output. This insight could enable faster renewable adoption, help reduce energy bills, and guide efficient investment into retrofit programmes.
Isabelle Chatel de Brancion, Land and Property Lead at Ordnance Survey, commented:
“Understanding which homes are hardest to heat is critical for improving energy efficiency. Ordnance Survey data provides detailed insights into building age, construction materials, and location, enabling us to model heat-loss risk at scale. This data-driven approach helps pinpoint areas most vulnerable to heat loss and identify where energy-efficiency improvements would have the greatest impact.”
OS is already supporting the delivery of low‑carbon heat networks and government heat decarbonisation ambitions. This includes a partnership with Arup, appointed in 2024 by the Department for Energy Security and Net Zero (DESNZ), to identify and develop heat network zones across England, underpinned by OS data.
Conclusion
By applying OS NGD building attributes to create a heat index, it is possible to visualise where homes are most at risk of heat loss. These insights can help target retrofitting, insulation upgrades and renewable investment, supporting warmer homes, lower energy bills and more effective decision making across Britain.
